Are crypto macro voices right? We test them.
2026-10-06
By Gregory Turkawka. First published on zenko.report; the figures are those of the scoreboard of 6 October 2026.
Since 2 September a program I wrote has been trading a crypto account by itself. I judge it against one thing: holding Bitcoin and doing nothing. If it can’t beat that, there’s no point.
Zenko Research is where I show the work. Most of the ideas for improving the machine come from the system itself. A research agent, a program, keeps proposing changes and tests each one against the machine as it runs today. Other ideas come from me, when I read the results. And some come from people out there, which is what this piece is about.
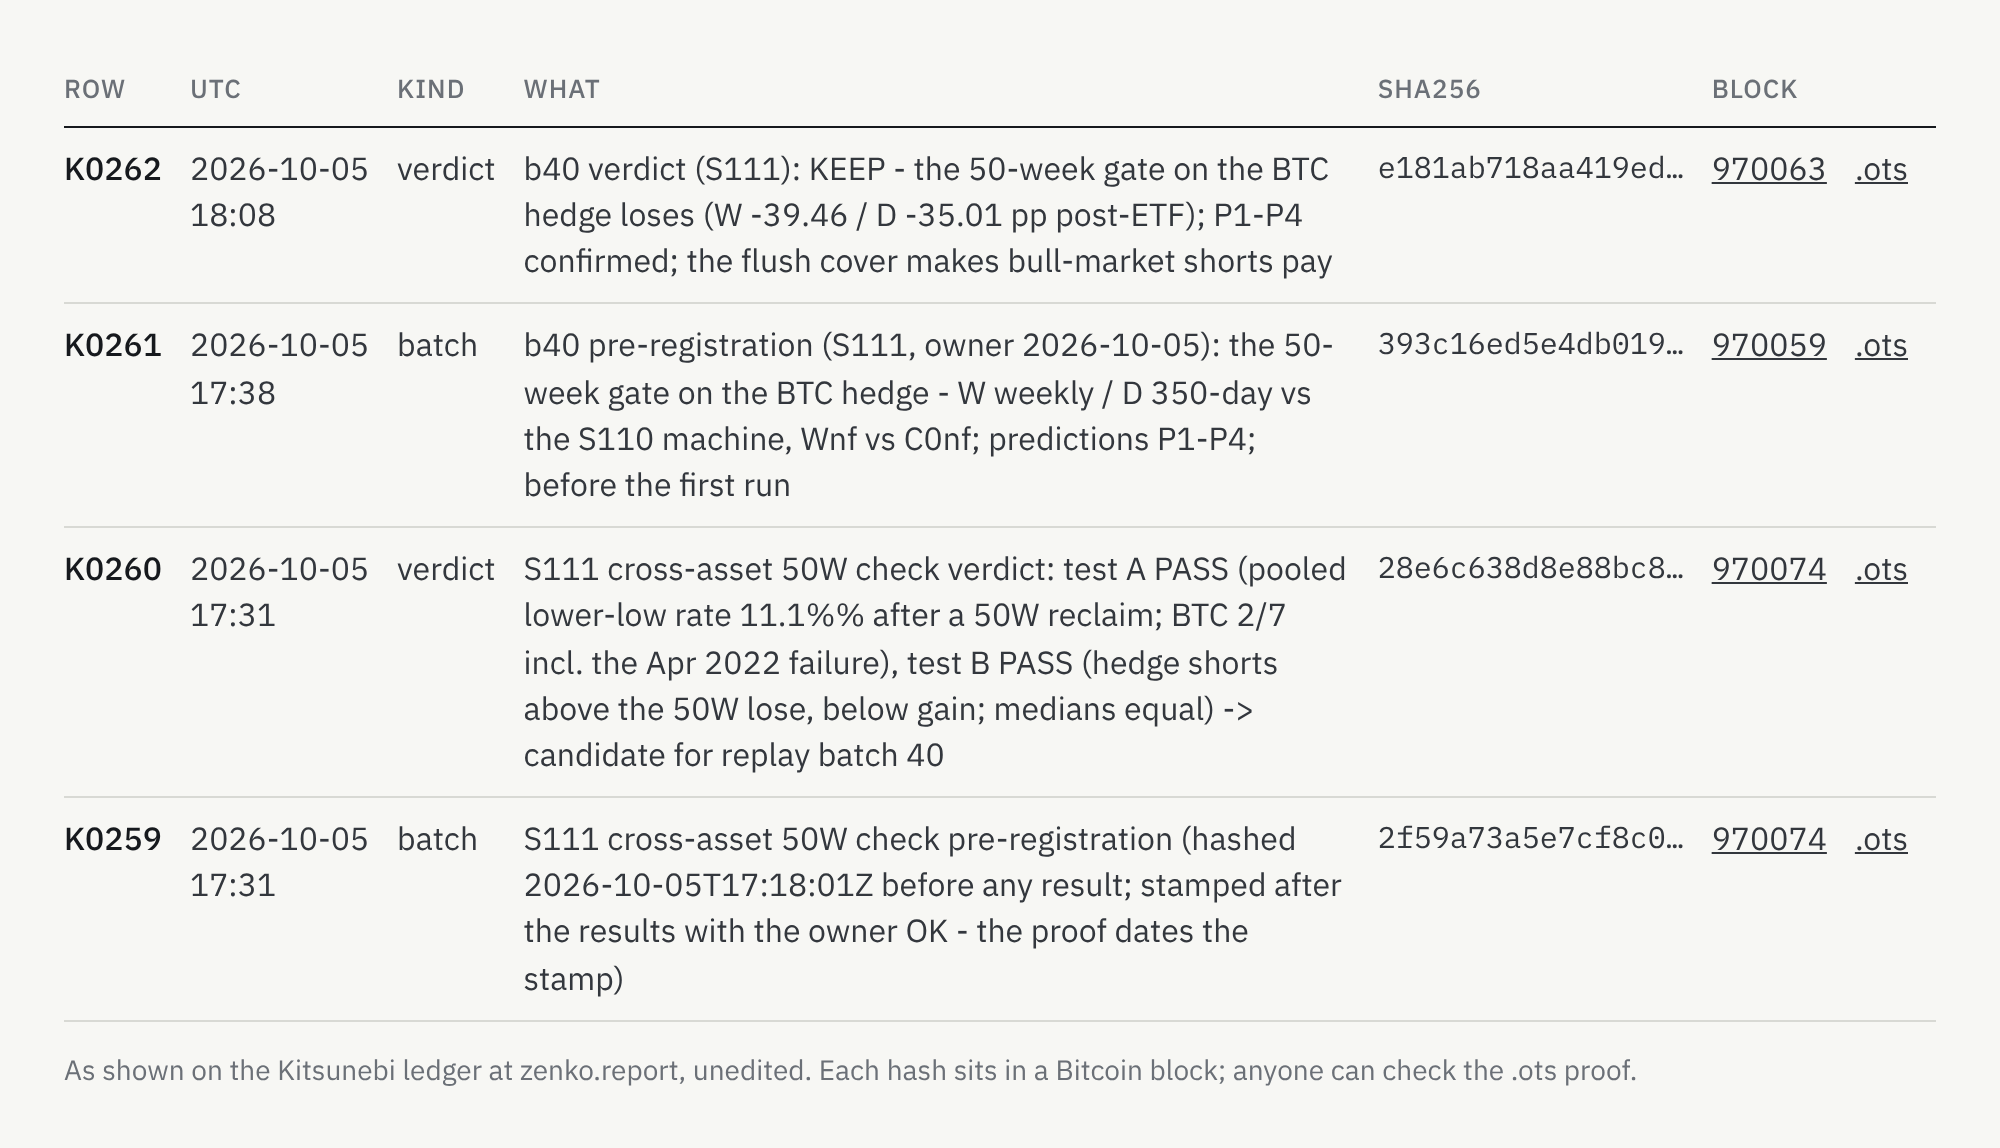
Every idea gets the same treatment. Before I test it, I write down what I think will happen. That note gets a timestamp in the Bitcoin blockchain, so I can’t quietly change it afterwards. Then I publish the result, good or bad. Most ideas don’t beat the machine, and that’s normal, because the machine is the bar. When I do change the machine, the old version keeps running next to the real account as a shadow book, so I can see later whether the change was a good one. It’s all on zenko.report.
We read the news, we follow a lot of people and we analyse what they say. The machine doesn’t act on any of it by itself. I decide every change to its rules, and only after a test.
What we did with the voices so far
I listen to macro analysts, traders on YouTube, newsletters and a few research desks. Until now we only used them for their calls, meaning the concrete predictions: “LINK goes to this level”, “Bitcoin holds that one by the end of the month”. A language model picks those out of what they publish. When the date comes, we check. That’s easy, and after a while you see who is good at it. We have about 140 of those calls so far, most of them still open.
Now we’ve started doing something else with them. We take their ideas and run them. Some help us see the market differently. Once in a while one might even become a rule. What we want to know is whether the way someone reads the market holds up when you test it. That’s a different question from whether they got last week right.
How the macro voices argue
Most macro commentary explains what already happened. The best-known example in crypto is the liquidity chart. You put Bitcoin and the world’s money supply on one chart, shift the money line by ten or twelve weeks, and the two match.
They match because the chart is built to match:
- The shift is picked afterwards. You try different shifts and keep the one that fits best. Colin Talks Crypto, one of the most careful people doing this, moved his from 108 days in March 2025 to 87 in May and 71 in June.
- It uses numbers nobody had at the time. Most countries publish money supply once a month, weeks later, and revise it after that. A daily chart drawn today fills in the gaps with the final numbers. In April 2025 India’s figures were revised and suddenly jumped about tenfold back in time, and the series was dropped.
- When it stops matching, the shift moves. Liam Wright showed that the best-fitting shift keeps changing, and that the same shift went from a strong match to the opposite after the October 2025 top.
So what do we do differently? The idea behind the chart is a forecast: money supply goes up now, Bitcoin goes up about ten weeks later. We keep that forecast exactly as the author gave it, with his shift, and fix it before we look. We use each number as it was first published, not the revised one. We count every stretch, the misses as well as the hits. And we compare it with how often Bitcoin went up anyway. Over its history Bitcoin rose in most three-month stretches, so “Bitcoin went up after money supply went up” is right more often than not even if the two have nothing to do with each other. A forecast has to beat that. Then we let it run on new data, where nobody can move the shift any more.
The crypto macro mantra
In crypto macro almost everyone says some version of “Bitcoin follows liquidity”. The versions differ, and that’s what makes them testable.
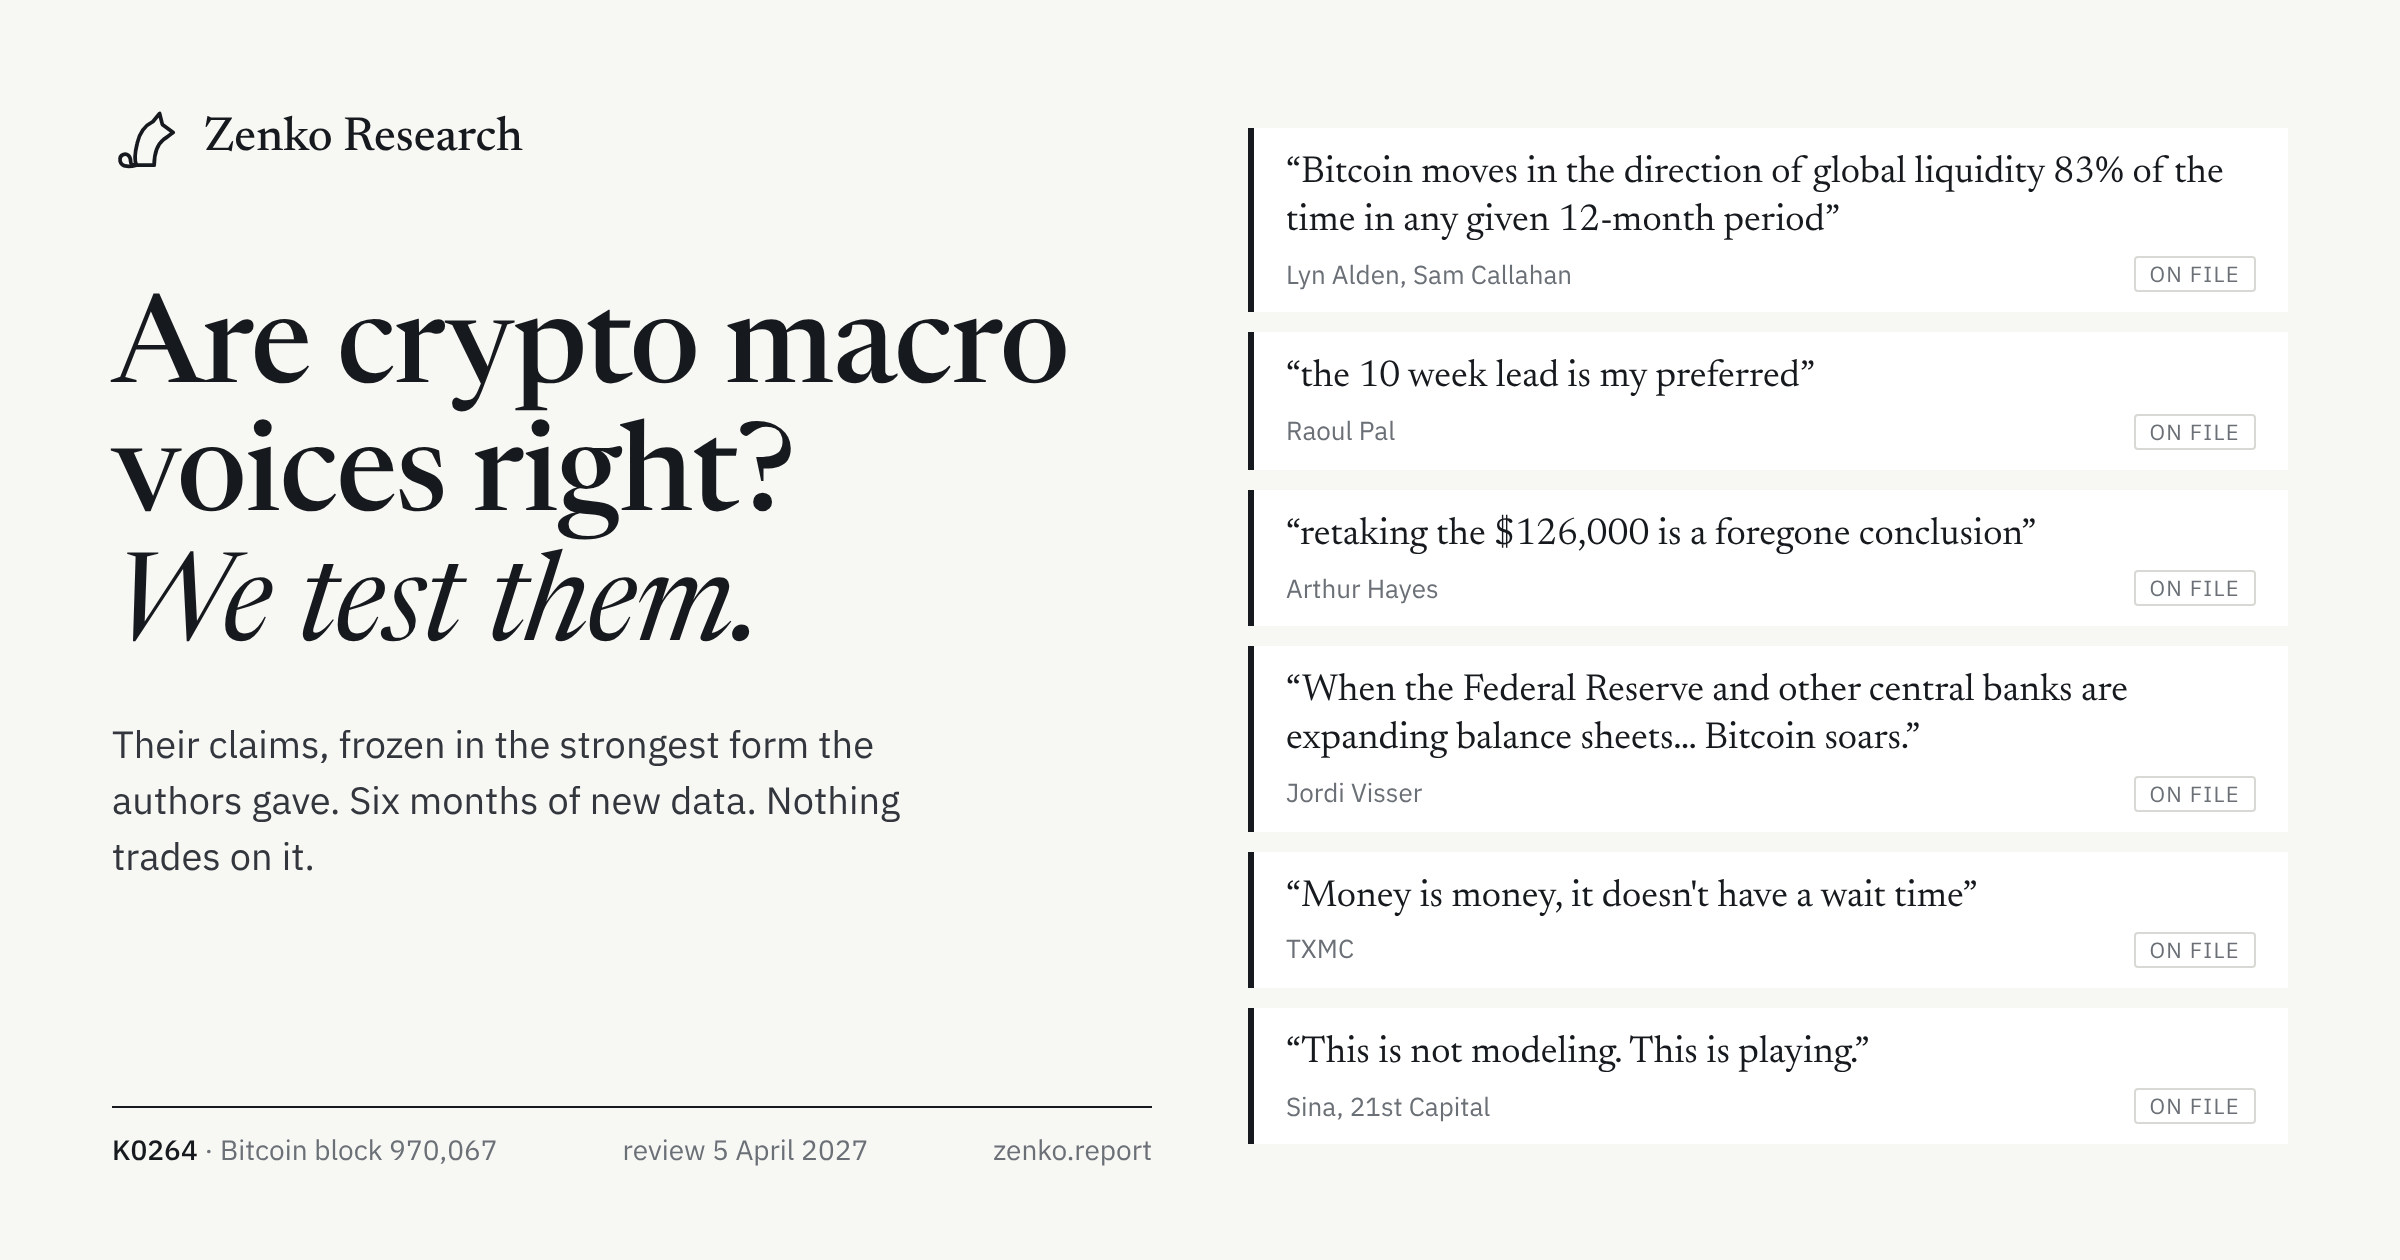
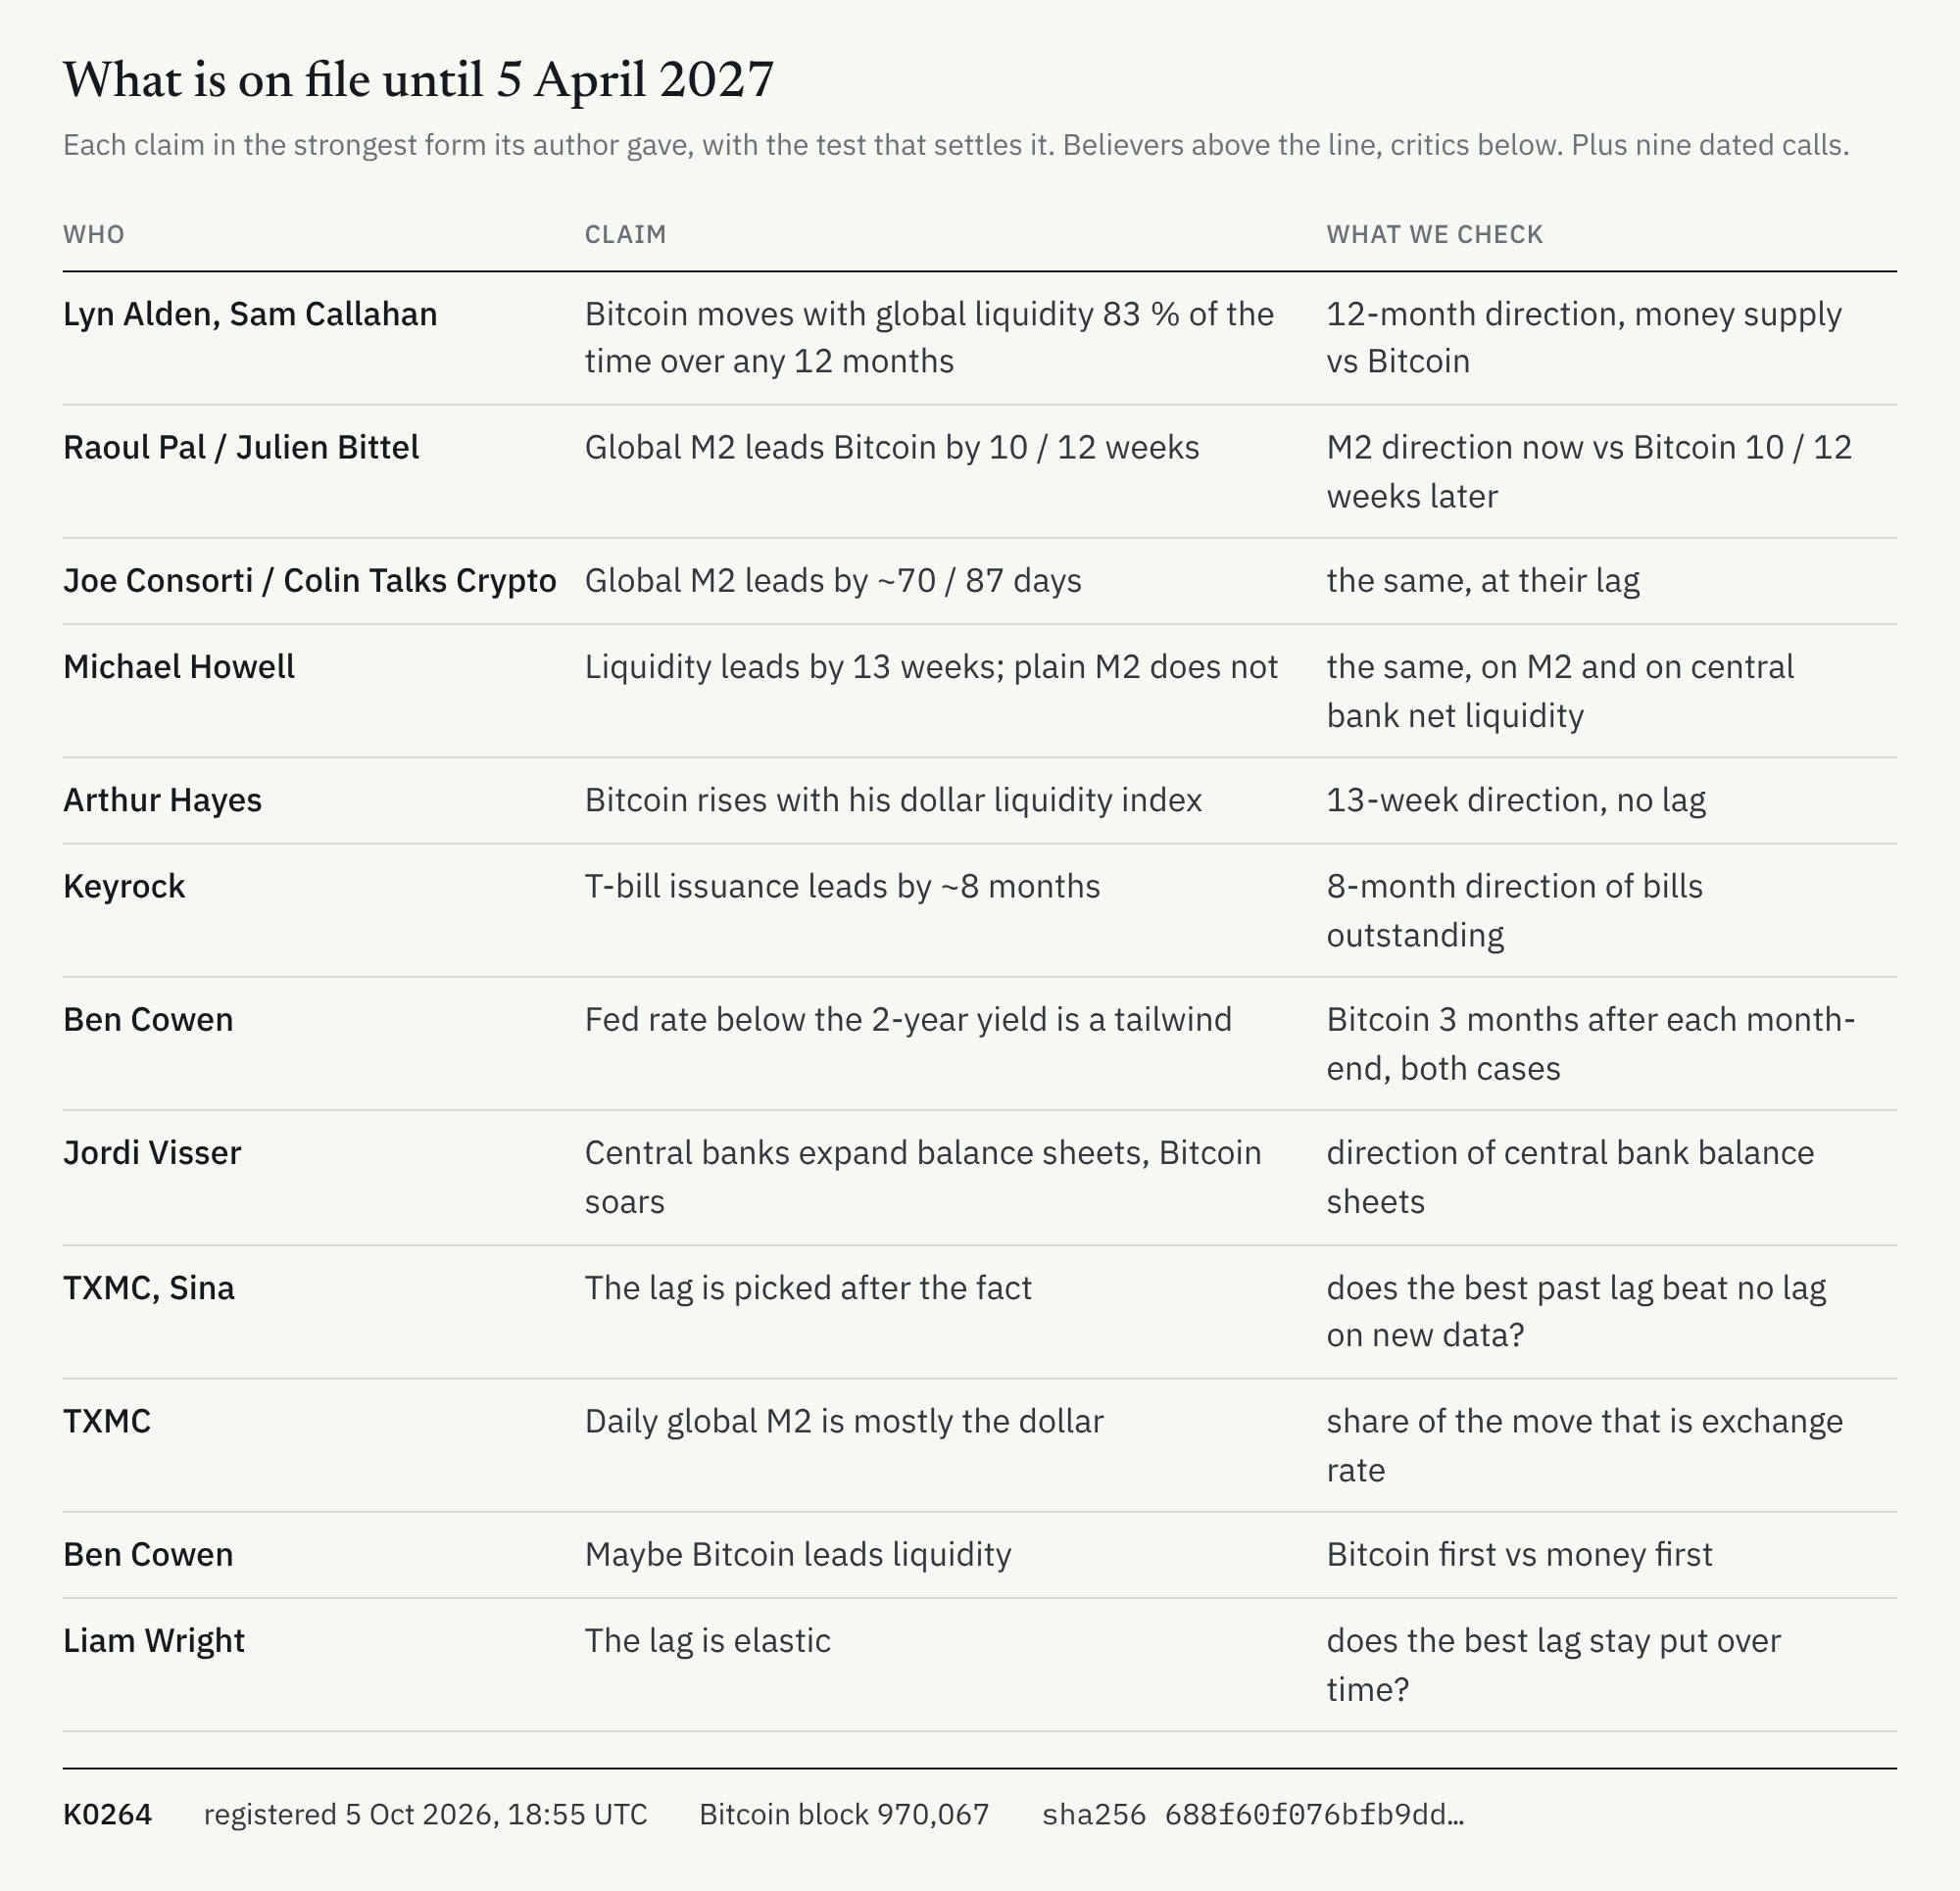
Lyn Alden and Sam Callahan found that Bitcoin moved in the same direction as global liquidity 83 % of the time over any 12 months. Raoul Pal likes global money supply leading Bitcoin by ten weeks, Julien Bittel by twelve. Joe Consorti saw a lag of about 70 days, Colin Talks Crypto 87. Michael Howell says his own liquidity index leads by about thirteen weeks and plain money supply doesn’t. Arthur Hayes has his own dollar liquidity index, built from the Fed’s balance sheet. Keyrock found that US Treasury bill issuance leads by about eight months. Ben Cowen watches whether the Fed’s policy rate is below the two-year yield. And Jordi Visser: “When the Federal Reserve and other central banks are expanding balance sheets… Bitcoin soars.”
Then there are the critics. TXMC says a daily “global M2” is mostly the dollar exchange rate, and that “money is money, it doesn’t have a wait time”. Sina calls it “M2 astrology” and wrote: “This is not modeling. This is playing.” Cowen asked whether Bitcoin might lead liquidity instead of following it.
Some of the believers have said themselves where it broke. Colin wrote that money supply missed the last three cycle tops. Pal wrote that GMI’s mistake was not seeing US liquidity as the main driver. Hayes showed a chart of his own index going down while Bitcoin went up. I like that. It counts for them.
On 5 October we wrote all of these down, each in the strongest form the author gave, with the test that would settle it. We timestamped that file before we put liquidity data and Bitcoin side by side even once. Since then we collect the data every day and keep each number as first published. The same file has nine dated calls, like Hayes’s “retaking the $126,000 is a foregone conclusion” and Howell’s “Bitcoin may be nearer a cyclical floor”.
My own view is in there too. I don’t think monetary macro predicts Bitcoin, and less so every year. Two things changed the market. The spot ETFs brought a new kind of buyer with its own rhythm, and they broke old patterns: Matt Hougan at Bitwise has argued that ETFs and institutions are overpowering the old four-year cycle, and some blame them for the liquidity link breaking down. The second change is AI. A lot of money now moves between companies, into compute and into AI agents that pay each other, and much of it never shows up in the central bank numbers these charts are built on. If that’s right, the charts are measuring a shrinking part of the money that matters for Bitcoin. Hayes came closest to this in June, when he wrote that “AI sucked up all created dollars”. But in his reading the dollars still come from the central banks, and an AI bust brings the next big round of money printing. The agent side of it I haven’t seen anyone make a case for yet. It’s a view, not a result, and it will have to go through the same test as everyone else’s.
We look again on 5 April 2027. Six months isn’t much data, so the long history will count for more. We’ve already run the history and timestamped the result, but we keep it to ourselves until April. That way nobody, me included, can bend it to fit whatever happens next. Then I’ll write it up, whichever way it goes.
Ideas we turned into versions of our machine
Watching for six months is the slow part. The quicker part is building an idea into a copy of our machine and seeing what happens.
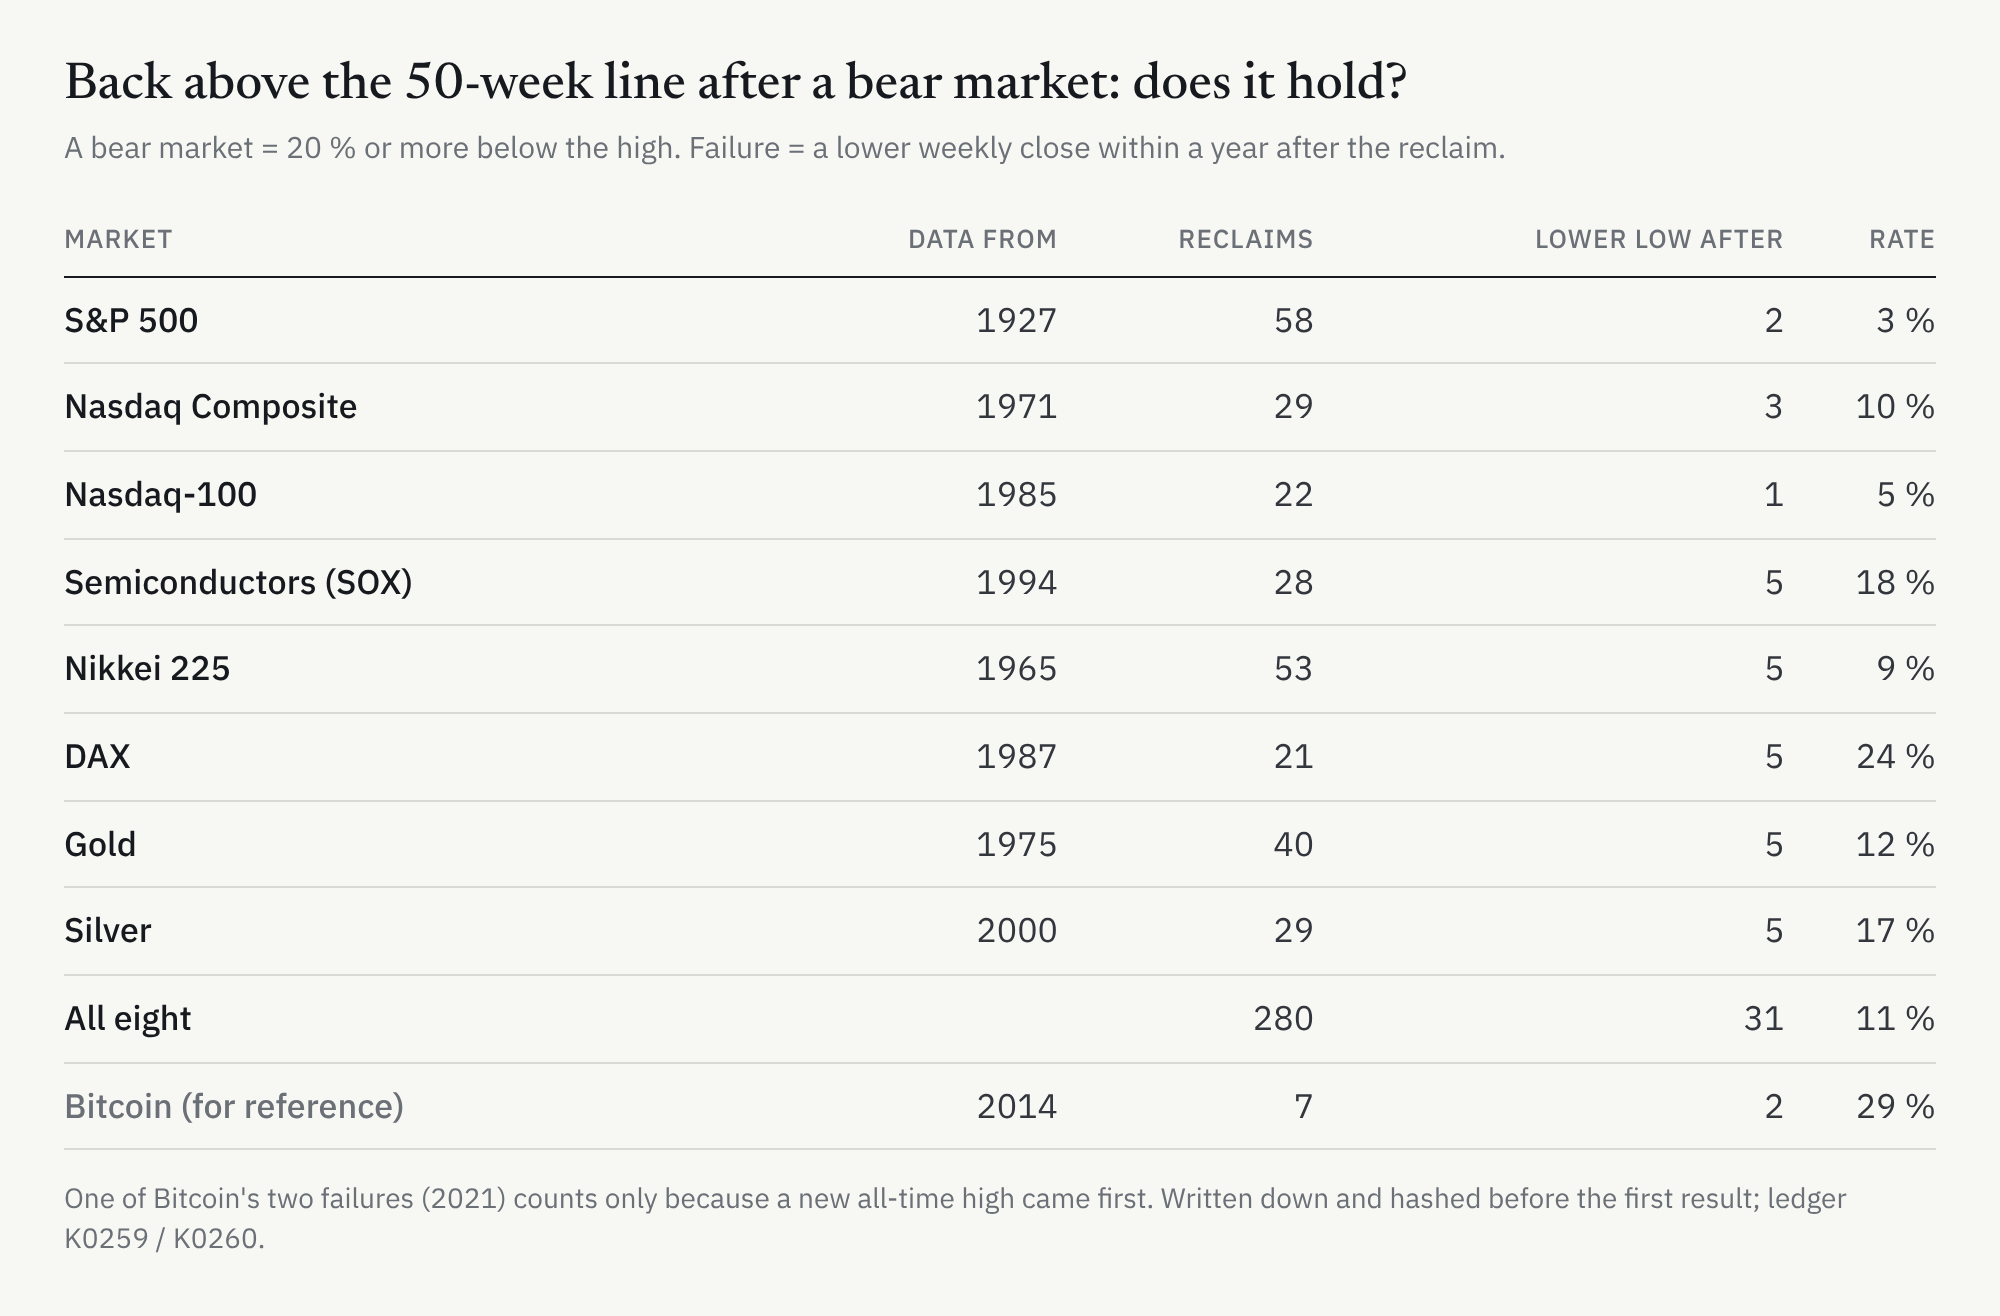
In a Real Vision interview at the end of September, Ben Cowen said that after a bear market, Bitcoin setting a low, getting back above its 20-week average and then above its 50-week average has never failed. Bitcoin has only had four cycles, which isn’t much to go on. So we checked the same thing on eight markets with longer histories: the S&P 500, two Nasdaq indices, the chip index, the Nikkei, the DAX, gold and silver. The S&P data goes back almost a hundred years. It mostly held. After the move back above the 50-week line, a new low came about one time in nine. On Bitcoin itself our version found two failures out of seven, one of them only because of how we defined a failure. Cowen’s wording (“and extending”) is stricter than ours, so I wouldn’t count that against him.
Then we built the copy: our machine, except its Bitcoin hedge isn’t allowed to go short while Bitcoin is above the 50-week line. On seven of the other eight markets that kind of filter helped. On our machine the hedge earned less, in every period we looked at. When we dug into why, it turned out the hedge’s best trades in 2024 and 2025 were shorts it closed fast into sharp sell-offs during a rising market. Exactly the ones the filter blocks. So the idea didn’t work as a rule for us. But it showed us how our own hedge makes its money, better than anything we’d written about it before.
Another one is max pain. The theory says Bitcoin gets pulled toward a certain options price before the monthly expiry, the price where the most options expire worthless. A copy of our machine with a max-pain rule has been running as a shadow book since before we went live. Right now it’s a fraction of a point behind our live book. The first result worth reading comes after the December expiry.
In September a chart went round saying cycle models showed Bitcoin about to fall off a cliff. We turned that into eight cycle and calendar rules, things like halving dates, Pi Cycle and a power law. None was good enough to get a shadow book of its own.
And Visser Labs published a trading experiment, moving-average crossovers with a volatility squeeze and a 200-day trend, together with the result that it didn’t work on US stocks. We ran it on our coins and inside our machine. Same answer. The signals failed, but I think more of someone who publishes his own failure.
What changed in our live book
Our live book has been running for 35 days and stands at 1.103 times holding Bitcoin. Five rules have changed since the start: one for position sizing, the event blackout, one for stops, one for the hedge and one for how much goes into altcoins. None of them came from a voice. They came from looking at our own results and from the research agent.
The event blackout was the closest the machine ever came to a common macro habit: don’t open anything new around CPI, the jobs report, Fed meetings and the big monthly option expiries. Lots of traders do that. We switched it off on 24 September. The copy that still has it is about a point behind the same machine without it. Eleven days prove nothing, so it keeps running as a shadow book.
What a new rule needs before it goes live
An idea from a voice gets the same treatment as one from me or from the research agent. To make it into our live book, it has to:
- be written down and timestamped before we test it, with what we expect it to do;
- beat our current machine, not just Bitcoin, on the stretch of history we rank on, and pass a separate check on the last twelve months;
- still work when we replay the same history along slightly different price paths;
- also work with settings close to the chosen one, not just one lucky number;
- not depend on one trade, one coin or one half-year;
- not make the worst drop deeper;
- give exactly the same result once it’s built into the live code.
After that the old rule keeps running as a shadow book, and I make the call.
No idea from a voice has made it yet. Several have taught us something about our own machine on the way.
In April we open the liquidity file and publish what’s in it.
Everything is on zenko.report: the scoreboard, all the shadow books, every result and every timestamp. The method page explains how we test. None of this is investment advice, and the system takes no outside money.